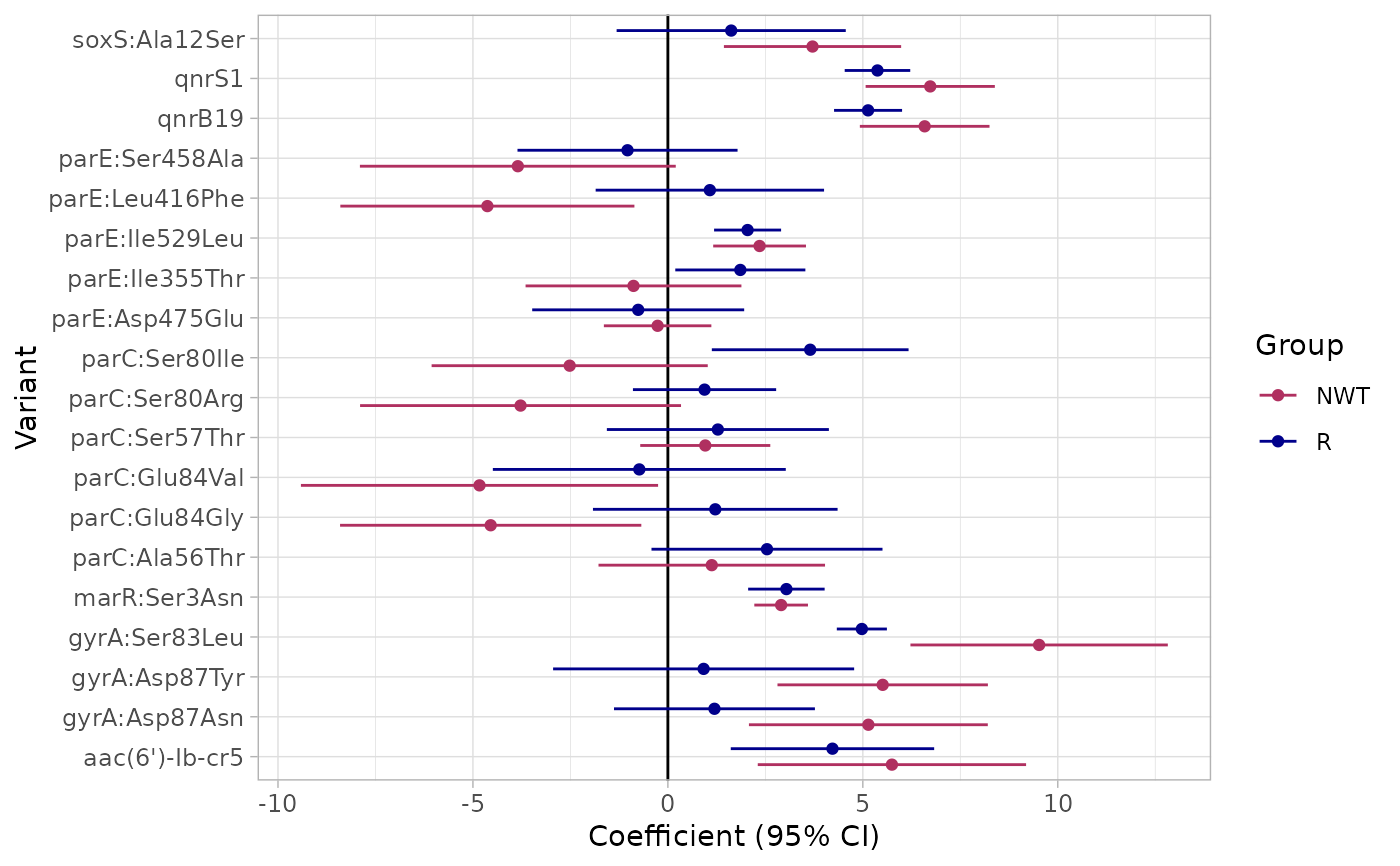
Performs logistic regression to analyze the relationship between genetic markers and phenotype (R, and NWT) for a specified antibiotic.
Usage
amr_logistic(
  geno_table,
  pheno_table,
  antibiotic = NULL,
  drug_class_list = NULL,
  geno_sample_col = NULL,
  pheno_sample_col = NULL,
  sir_col = "pheno",
  ecoff_col = "ecoff",
  marker_col = "marker.label",
  binary_matrix = NULL,
  maf = 10,
  fit_glm = FALSE,
  single_plot = TRUE,
  colors = c("maroon", "blue4"),
  axis_label_size = 9
)
Arguments
- geno_table
(Required if
binary_matrixnot provided) A data frame containing genotype data, formatted withimport_amrfp(). Only used ifbinary_matrixnot provided.- pheno_table
(Required if
binary_matrixnot provided) A data frame containing phenotype data, formatted withimport_ast(). Only used ifbinary_matrixnot provided.- antibiotic
(Required if
binary_matrixnot provided) A character string specifying the antibiotic of interest to filter phenotype data. The value must match one of the entries in thedrug_agentcolumn ofpheno_table. Only used ifbinary_matrixnot provided or if breakpoints required.- drug_class_list
(Required if
binary_matrixnot provided) A character vector of drug classes to filter genotype data for markers related to the specified antibiotic. Markers ingeno_tablewill be filtered based on whether theirdrug_classmatches any value in this list. Only used ifbinary_matrixnot provided.- geno_sample_col
A character string (optional) specifying the column name in
geno_tablecontaining sample identifiers. Defaults toNULL, in which case it is assumed the first column contains identifiers. Only used ifbinary_matrixnot provided.- pheno_sample_col
A character string (optional) specifying the column name in
pheno_tablecontaining sample identifiers. Defaults toNULL, in which case it is assumed the first column contains identifiers. Only used ifbinary_matrixnot provided.- sir_col
A character string specifying the column name in
pheno_tablethat contains the resistance interpretation (SIR) data. The values should be"S","I","R"or otherwise interpretable byAMR::as.sir(). If not provided, the first column prefixed with "phenotype*" will be used if present, otherwise an error is thrown. Only used ifbinary_matrixnot provided.- ecoff_col
A character string specifying the column name in
pheno_tablethat contains resistance interpretations (SIR) made against the ECOFF rather than a clinical breakpoint. The values should be"S","I","R"or otherwise interpretable byAMR::as.sir(). Defaultecoff. Set toNULLif not available. Only used ifbinary_matrixnot provided.- marker_col
(Optional) Name of the column containing the marker identifiers, whose unique values will be treated as predictors in the regression. Defaults to
"marker".- binary_matrix
A data frame containing the original binary matrix output from the
get_binary_matrix()function. If not provided (or set toNULL), user must specifygeno_table,pheno_table,antibiotic,drug_class_listand optionallygeno_sample_col,pheno_sample_col,sir_col,ecoff_col,marker_colto pass toget_binary_matrix().- maf
(Optional) An integer specifying the minimum allele frequency (MAF) threshold. Markers with a MAF lower than this value will be excluded. Defaults to
10.- fit_glm
(Optional) Change to
TRUEto fit model with glm. Otherwise fit model with logistf (defaultFALSE).- single_plot
(Optional) A logical value. If
TRUE, a single plot is produced comparing the estimates for resistance (R) and non-resistance (NWT). Otherwise, two plots are printed side-by-side. Defaults toTRUE.- colors
(Optional) A vector of two colors, to use for R and NWT models in the plots. Defaults to
c("maroon", "blue4").- axis_label_size
(Optional) A numeric value controlling the size of axis labels in the plot. Defaults to
9.
Value
A list with the following components:
binary_matrix: The binary matrix of genetic data and phenotypic resistance information (either provided as input or generated by the function).modelR: The fitted logistic regression model for resistance (R).modelNWT: The fitted logistic regression model for non-resistance (NWT).plot: A ggplot object comparing the estimates for resistance and non-resistance with corresponding statistical significance indicators.
Examples
# Example usage of the amr_logistic function
result <- amr_logistic(
  geno_table = import_amrfp(ecoli_geno_raw, "Name"),
  pheno_table = ecoli_ast,
  sir_col = "pheno_clsi",
  antibiotic = "Ciprofloxacin",
  drug_class_list = c("Quinolones"),
  maf = 10
)
#> Generating geno-pheno binary matrix
#>  Defining NWT in binary matrix using ecoff column provided: ecoff
#> ...Fitting logistic regression model to R using logistf
#>    Filtered data contains 3630 samples (793 => 1, 2837 => 0) and 19 variables.
#> Warning: logistf.fit: Maximum number of iterations for full model exceeded. Try to increase the number of iterations or alter step size by passing 'logistf.control(maxit=..., maxstep=...)' to parameter control
#> ...Fitting logistic regression model to NWT using logistf
#>    Filtered data contains 3630 samples (929 => 1, 2701 => 0) and 19 variables.
#> Warning: logistf.fit: Maximum number of iterations for full model exceeded. Try to increase the number of iterations or alter step size by passing 'logistf.control(maxit=..., maxstep=...)' to parameter control
#> Generating plots

# To access the plot:
print(result$plot)
# To access the plot:
print(result$plot)